Spend
Spend covers the value story: Cost, what it takes to run the system, and Savings, what the agents give back in time and dollars. Read them together for the same window to see whether the system is paying for itself.
Cost
Cost reads from your live spend record and updates as calls complete, covering a 30-day window. A glance band totals your Period Cost, Daily Average, a 30-Day Projection, your action count, and cost per action. A daily trend chart sits above two breakdowns: spend by agent, and spend by model.
The page also links to where you set daily spend ceilings, if you want to cap what any given day can cost.
Savings
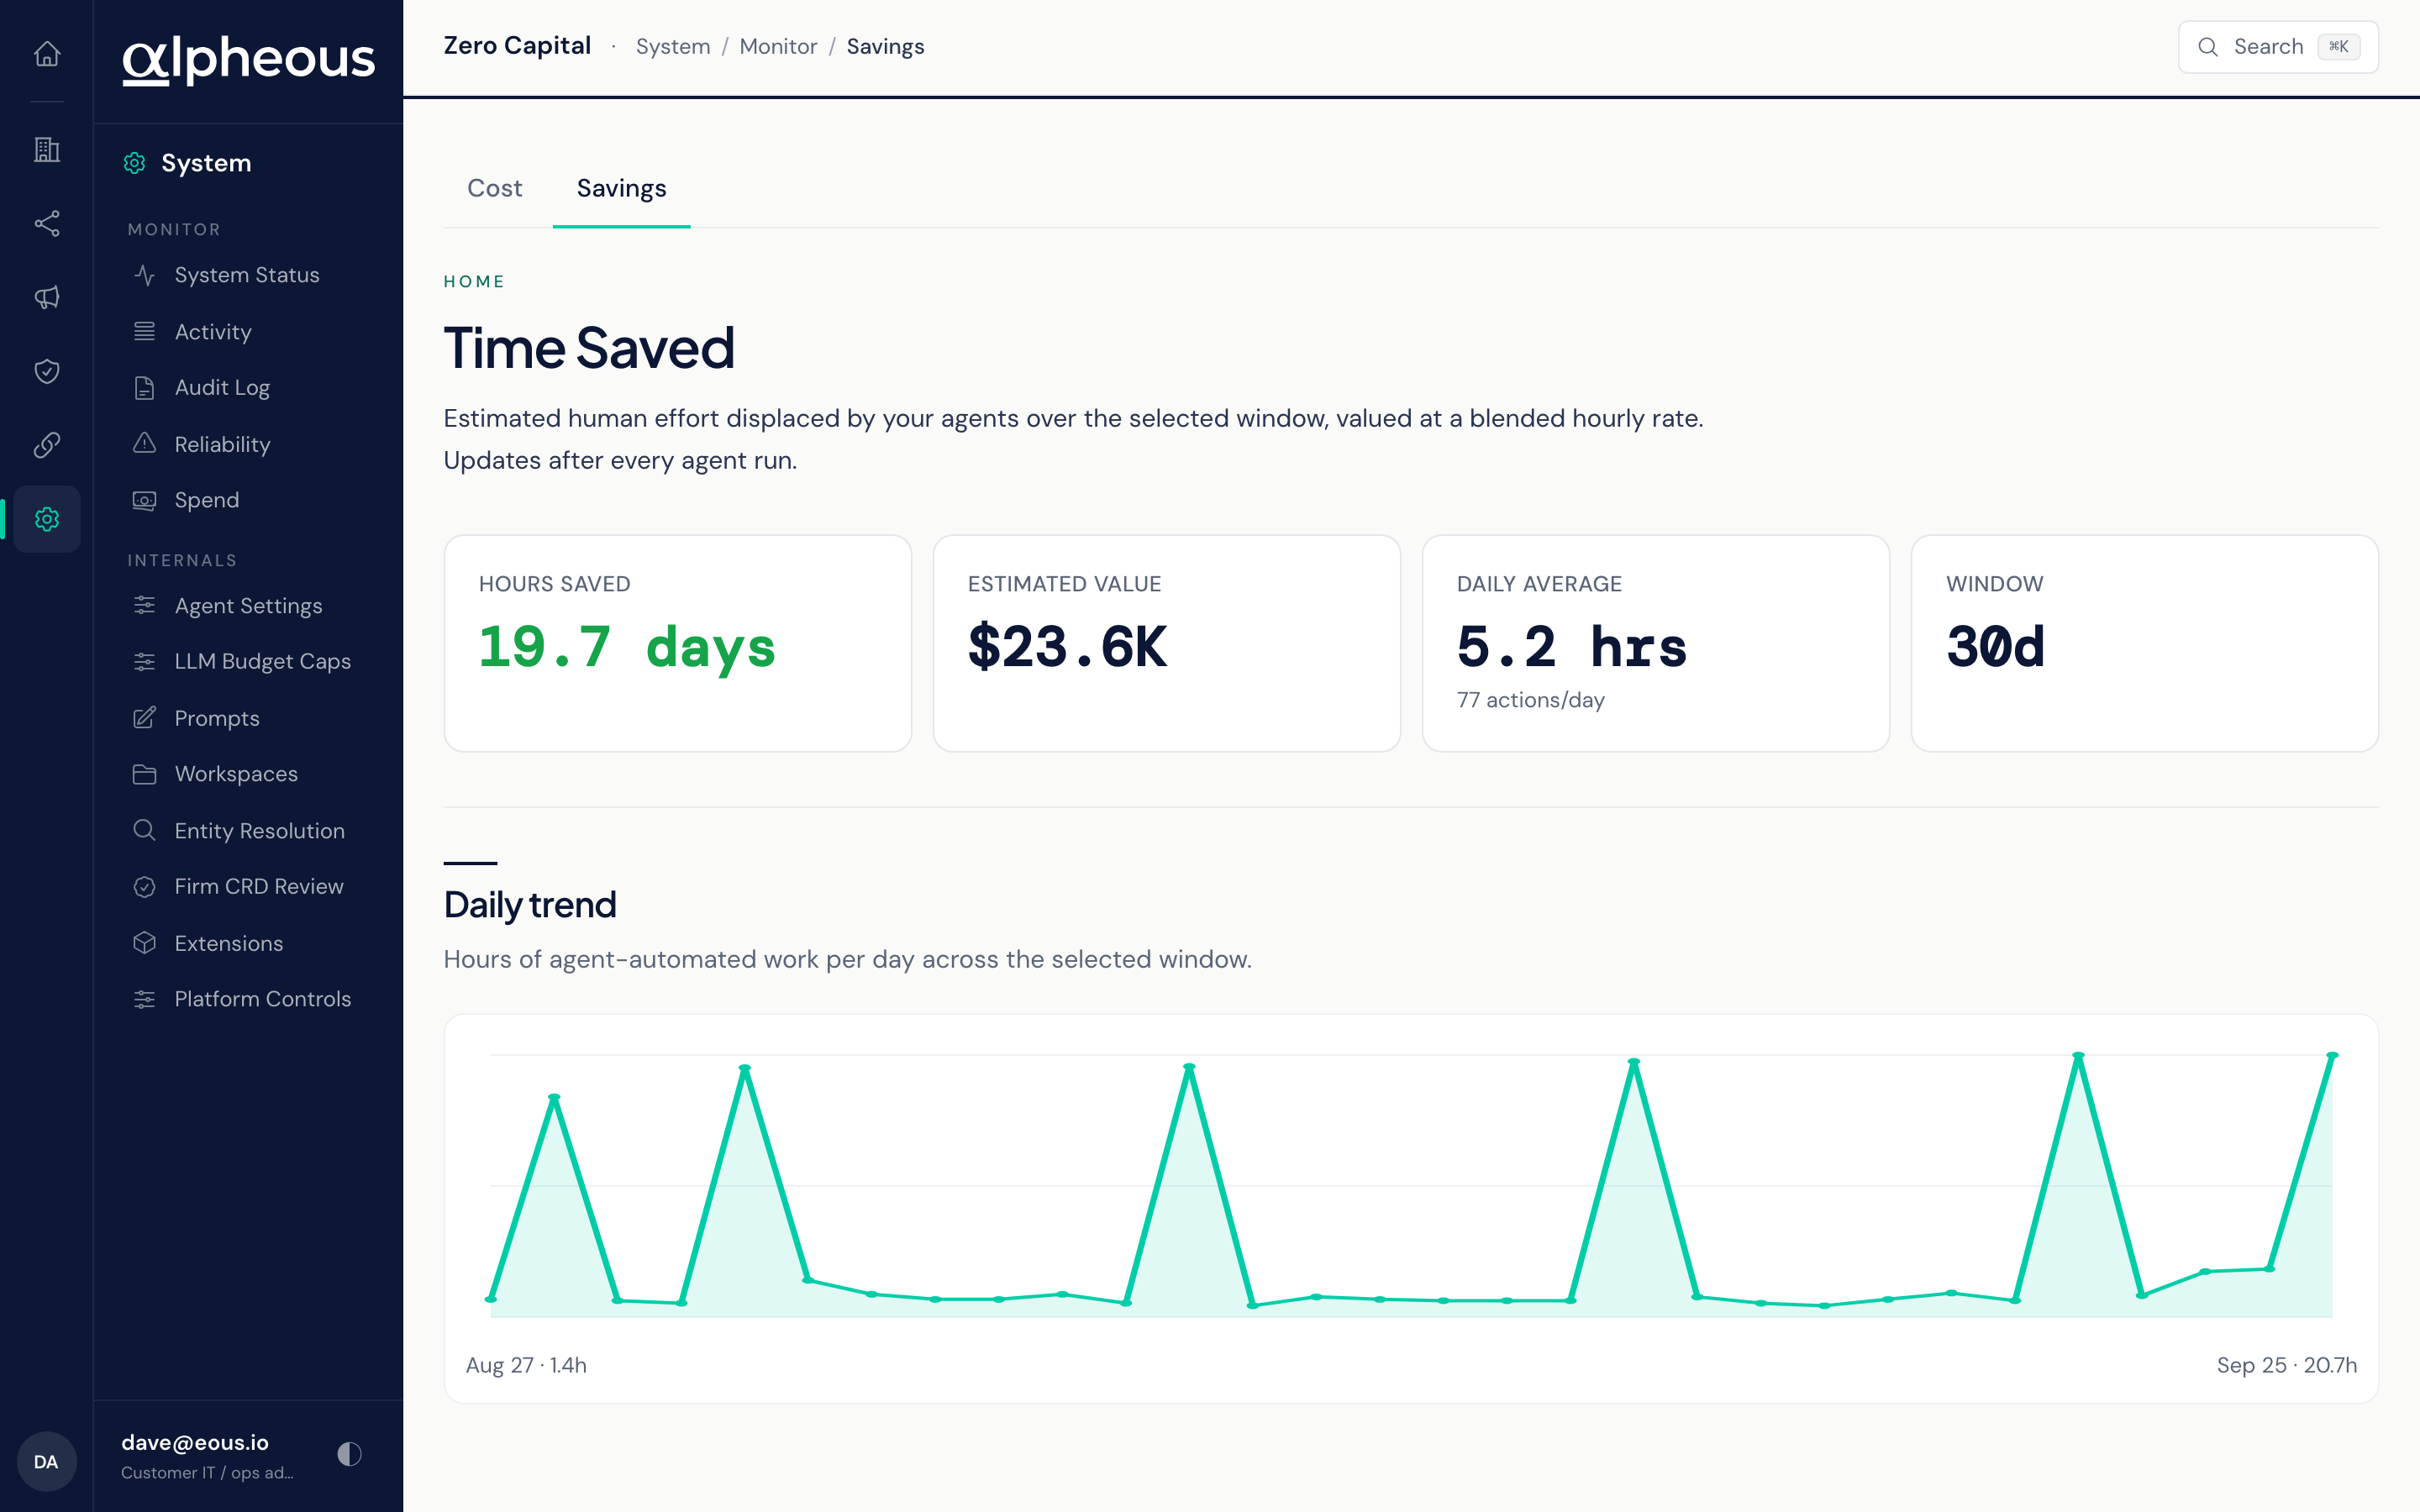
Savings estimates the human effort the agents displaced over your selected window, valued at a blended hourly rate, updating after every agent run. A glance band shows Hours Saved, Estimated Value, Daily Average, and the Window you're viewing. Once total hours for the window reach 24 or more, the headline figure switches from hours to days. A daily trend chart shows hours of agent-automated work per day across the window, which you can set from 1 to 90 days.
Together, Cost and Savings for the same window are what you'd bring to anyone asking whether the system is worth what it costs.
Related
- System Status: the agent activity this spend is drawn from.
- Reliability: errors and incidents, for the other side of system health.